Every month, the statistics ministry releases a number. Retail inflation is 4-point-something percent, the headlines say, comfortably inside the RBI’s tolerance band. And every month, millions of Indians read that number, look at what they just paid for arhar dal and school fees, and quietly wonder whether anyone at MoSPI has visited a sabzi mandi recently.
You are not imagining the gap. It is real, it is measurable, and it is mostly explainable once you know how the index is built. Understanding it also changes how you plan your investments and set return targets, because almost every financial decision you make is secretly a bet on an inflation number.
Let us take the official CPI apart, piece by piece.
What the Official CPI Actually Measures
India’s headline retail inflation comes from the Consumer Price Index (Combined), built on a 2012 base year. The National Statistical Office collects roughly 300 items of price data from about 1,100 villages and 1,100 urban markets every month.
The critical thing to understand: CPI is not a measure of what prices are. It is a measure of what one specific, fixed, averaged-out shopping basket costs this month versus the same month last year.
That basket was designed using consumption patterns from the 2011-12 Consumer Expenditure Survey. Here is roughly how it is weighted:
| Category | Weight in Combined CPI |
|---|---|
| Food and beverages | 45.86% |
| Miscellaneous (health, education, transport, personal care) | 28.32% |
| Housing (urban only) | 10.07% |
| Fuel and light | 6.84% |
| Clothing and footwear | 6.53% |
| Pan, tobacco and intoxicants | 2.38% |
Every criticism of the number that follows traces back to one of these weights, or to what sits inside them.
Problem One: The Basket Is Fifteen Years Out of Date
The weights above describe how an average Indian household spent money in 2011-12. Think about what your own spending looked like then.
No monthly OTT subscriptions. Probably no data pack worth talking about. Far less spent on cab rides, food delivery, gym memberships, diagnostic tests, or coaching classes.
The government’s own Household Consumption Expenditure Survey for 2022-23 confirmed the shift. Food had fallen to roughly 46% of rural household spending and about 39% in urban households – well below the weights still embedded in the index. Services and discretionary spending had grown to fill the gap.
So the index keeps giving heavy weight to a category where Indians now spend proportionally less, and light weight to categories where spending has exploded. A base-year revision has been in the pipeline for years. Until it lands, the arithmetic is anchored to a household that no longer exists.
Problem Two: Food Inflation Is Volatile, and Volatility Hides Pain
Food is nearly half the index, which sounds like it should capture your grocery pain perfectly. It does not, for a subtle reason.
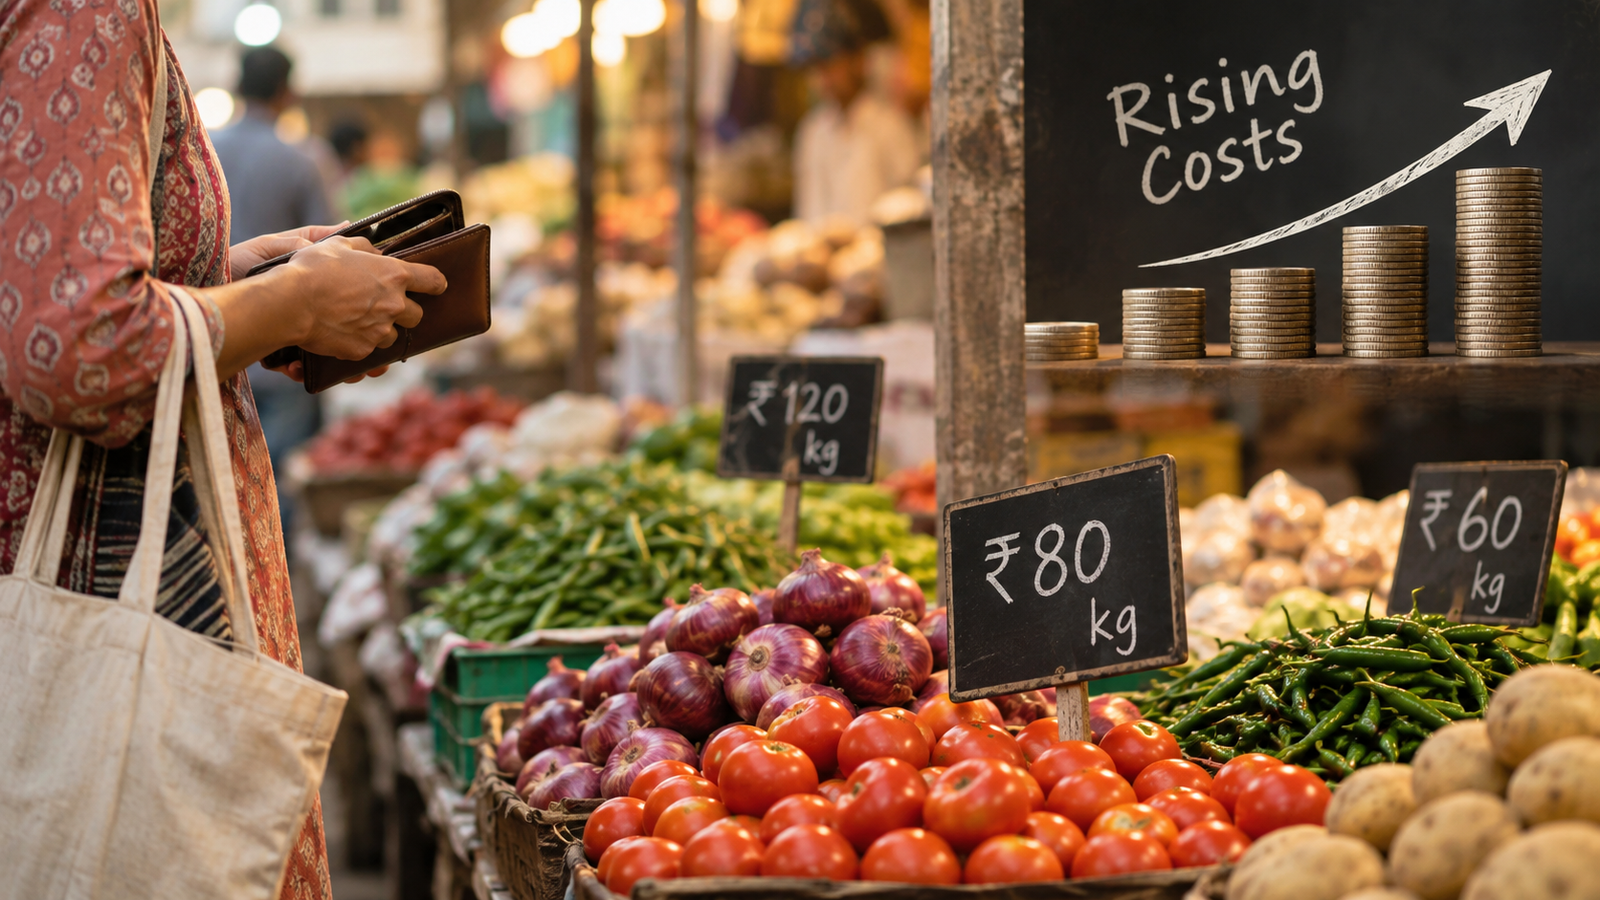
Food inflation in India swings violently. Tomatoes triple in six weeks and then collapse. Onions spike every couple of years. A good monsoon pushes vegetable prices down hard.
Here is what that does to the average. A crash in vegetable prices can pull the entire headline number down even while cereals, pulses, edible oil, and milk – the things you buy every single week regardless of season – keep climbing steadily.
The headline says inflation cooled. Your kitchen budget says nothing cooled. Both statements are true. You buy the stable items constantly and the volatile items occasionally, so your lived experience tracks the sticky half of the food basket, not the average of the whole thing.
The Reverse Also Applies
When tomatoes spike, headline inflation jumps and everyone panics about a crisis that will unwind in two months. The index amplifies noise in both directions. This is exactly why economists watch core inflation – the index stripped of food and fuel – and why the RBI never reacts to one month of data.
Problem Three: Housing Is Barely in the Index at All
This is the biggest single gap between the number and the experience, especially for urban salaried households.
Housing carries a 10.07% weight in the combined index. In rural CPI, it carries zero weight. And in the urban series, where it does count, the index tracks house rent – not property prices, not stamp duty, not the cost of buying.
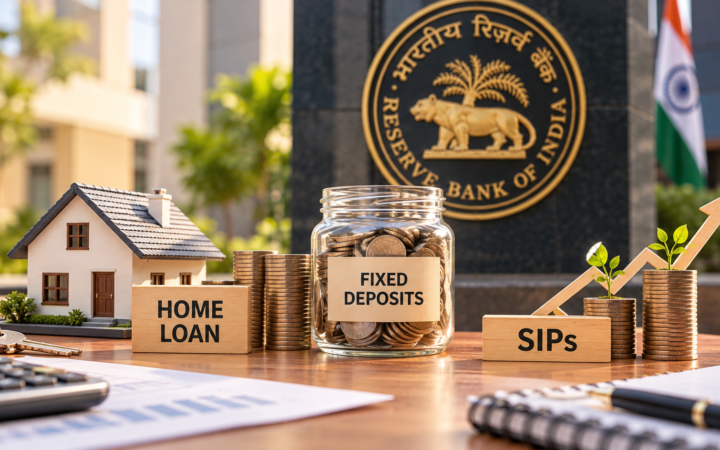
Also missing: your home loan interest. EMIs are a financing cost, not a consumption item, so the CPI simply does not include them. When lending rates move, your largest monthly outgo can change by thousands of rupees and the inflation figure will not register a thing. If you carry a loan, the RBI’s rate cycle hits you through a completely separate channel – and it is worth understanding what RBI rate decisions actually do to your home loan EMI, because that is where a lot of urban household inflation really lives.
Meanwhile, anyone renting in Bengaluru, Pune, Gurugram or Mumbai over the last few years has seen hikes that bear no resemblance to a 10%-weighted national rent index. Landlord asks for 15% more. CPI records a fraction of that, averaged across hundreds of towns where rents barely moved.
Problem Four: Rural and Urban India Live in Different Price Worlds
The NSO publishes three series: rural, urban, and combined. The headline you read is the combined figure – and it can hide a genuinely wide divergence.
The baskets are structurally different:
- Rural CPI gives food and beverages a far heavier weight – around 54%. Housing gets nothing. Fuel matters more.
- Urban CPI puts food at roughly 36%, gives housing about 22%, and loads far more weight onto transport, education, and health services.
The practical consequence: a food-price shock hurts rural households disproportionately, while a services-and-rent squeeze hits urban households harder. The combined number splits the difference and describes neither group accurately.
If you live in a metro, the rural series is almost irrelevant to your life – yet it makes up a majority of the combined index by population weight.
Problem Five: The Services You Cannot Avoid Are Underweighted
Inside that 28% miscellaneous bucket sit the three expenses that quietly wreck Indian middle-class budgets:
- Education – roughly 4.5% of the index. School fee hikes of 8-12% a year are routine in private urban schools. Coaching costs more still.
- Health – roughly 6%. Hospitalisation costs and insurance premiums have risen far faster than headline CPI for years.
- Transport and communication – roughly 8.6%, covering everything from petrol to your data plan.
If you have two children in private school and a family health cover, education and healthcare might be 20% of your actual outgo. The index says they are about 10%. Your personal inflation rate will run structurally above the official one, permanently, and no statistical fix is going to change that.
Problem Six: Substitution and Shrinkflation
Two smaller effects worth naming.
Substitution. A fixed-basket index assumes you keep buying the same things. In reality, when arhar dal gets expensive you switch to moong. The index does not fully capture that downgrade – and a downgrade is a welfare loss that never shows up as inflation.
Shrinkflation. The biscuit packet stays at ten rupees but drops from 80g to 70g. Price data collectors are supposed to adjust for quantity, but in practice packaged-goods shrinkage is under-captured across thousands of SKUs. You pay the same and get less. The index sees no inflation.
So Is the Government Faking the Number?
No. And this matters, because the honest critique is more useful than the conspiracy one.
India’s CPI methodology is broadly consistent with international standards. The data collection is real. The bigger problems are structural: an outdated basket, a housing component that does not reflect what housing costs, and the basic fact that a single national average cannot describe a country where a Bihar farmer and a Bengaluru software engineer face completely different price curves.
The number is not a lie. It is an average – and you almost certainly do not live at the average.
How to Calculate Your Own Inflation Rate
This is the part that actually changes your financial planning. It takes about twenty minutes.
- Pull twelve months of bank and card statements. Group every rupee into six buckets: food and groceries, rent or EMI, transport and fuel, education, health and insurance, everything else.
- Work out each bucket’s share of your total annual spending. That is your personal weight set.
- Compare against the same period last year. Most banking apps let you export this. Calculate the percentage change in each bucket.
- Multiply each bucket’s change by its weight and add them up. That is your real inflation rate.
Urban households with children, rent, and a health cover commonly land 2-4 percentage points above the headline CPI. If yours does, every return assumption you have ever made needs revising upward by the same margin.
What This Means for Your Money
Three consequences follow directly.
Your fixed deposit is probably losing money. If your personal inflation is 8% and your FD pays 7% before tax, you are going backwards in real terms every year – while the headline number tells you that you are comfortably ahead.
Your retirement corpus target is too low. Most calculators default to 6% inflation. Run yours at your real number and the required corpus can jump by 30-40%. Better to find that out now than at 58.
Your asset allocation needs to be more aggressive than the headline suggests. Beating 4% CPI is easy. Beating your actual 8% is not, and it generally requires real ownership of productive assets rather than guaranteed-return instruments.
None of this means you should ignore official data – it drives RBI policy, bond yields, and your loan rates, so it matters enormously. It simply is not your personal cost-of-living index. For the wider backdrop on how these forces fit together, it is worth reading our breakdown of India’s economy, growth numbers and the risks nobody talks about.
Measure your own inflation. Plan against that. The headline is for the central bank; the number in your bank statement is for you.